Slideshow


European Cups Ranking System Explanation ECRS Ranking Comparison between nations in European Cups

mercoledì 31 dicembre 2014

Ability to equalize


I made a ranking about the ability of scoring or not conceding an equalizer.
The data are all from the current season, and refers to the domestic leagues of England, France, Germany, Italy, Portugal and Spain.
I took them from soccerstats.com

The first table refers to the ability to score an equalizer after having conceded a goal that gave the lead to the opponent.
I took into consideration only the teams who conceded a "leading goal" to the opponent a number of times equal at least to the 66% of the matches played.
MP = matches played
GGLO = number of goals that gave the lead to the opponents
EGS = number of equalizer goals scored by the team
ATE = ability to equalize (ratio between EGS and GGLO)

[​IMG]
For example, Inter Milan played 16 matches this season, conceding 14 times a goal that gave the lead to their opponents, and 9 times they were able to equalize it. Their ability to equalize is then 64,29% (9/14).


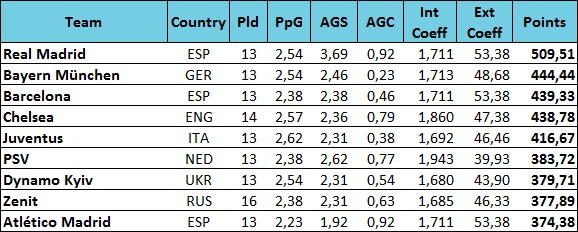
The second table is about the ability to not conceding an equalizer after having taken the lead.
I took into consideration only the teams who scored a "leading goal" a number of times equal at least to the 66% of the matches played.
MP = matches played
GGL = number of goals that gave the lead to the team
EGC = number of equalizer goals conceded to the opponent
OATE = opponent's ability to equalize (ratio between EGC and GGL)

[​IMG]
Real Madrid played 15 games, scored 15 "leading goals" and conceded only 2 equalizers to their opponents, for an OATE of 13.33% (2/15). When they take the lead of a match, they hardly lose it.

Please note that a team could score or concede more than one "leading goal" and/or equalizer per game. Example: team A vs team B; team A scores the first goal of the match, going on 1-0; then team B equalizes to 1-1; then team A scores the 2-1, and team B scores the final 2-2. In this match, team A scored 2 goals that gave them the lead, and conceded 2 equalizers; viceversa for the team B, who scored 2 equalizers and conceded 2 goals that gave the lead to the opponent.


Ho creato una classifica riguardante l'abilità di segnare o di non subire una rete che porta al pareggio (equalizer).
I dati riguardano la stagione in corso, e si riferiscono ai campionati di Inghilterra, Francia, Germania, Italia, Portogallo e Spagna.
Ho preso i dati dal sito soccerstats.com

La prima tabella fa riferimento all'abilità di segnare il gol del pareggio dopo aver concesso alla squadra avversaria una rete che l'ha portata in vantaggio (d'ora in poi, "leading goal").
Ho preso in considerazione solamente le squadre che hanno concesso all'avversario un "leading goal" un numero di volte pari almeno al 66% delle partite giocate.
MP = partite giocate
GGLO = numero di reti che hanno portato l'avversario in vantaggio
EGS = numero di reti che hanno portato la squadra al pareggio
ATE = abilità di pareggiare (rapporto tra EGS e GGLO)

[​IMG]
Per esempio, l'Inter ha giocato 16 partite finora, subendo 14 reti che hanno portato l'avversario in vantaggio, e riuscendo per 9 volte a pareggiare. La loro abilità di recuperare un vantaggio dell'avversario è quindi il 64,29% (9/14).


La seconda tabella si riferisce all'abilità di non concedere il gol del pareggio all'avversario, dopo essere passati in vantaggio.
Ho preso in considerazione solamente le squadre che hanno segnato un "leading goal" un numero di volte pari almeno al 66% delle partite giocate.
MP = partite giocate
GGL = numero di reti che hanno portato la squadra in vantaggio
EGC = numero di reti del pareggio concessi all'avversario
OATE = abilità dell'avversario di pareggiare (rapporto tra EGC e GGL)

[​IMG]
Il Real Madrid ha giocato 15 partite, segnando 15 "leading goals" e concedendo solo 2 reti del pareggio, per un OATE del 13.33% (2/15). Quando i blancos passano in vantaggio, è quindi molto difficile riprenderli. 

Nota bene: una squadra potrebbe segnare o subire più di un "leading goal" o "equalizer" durante la stessa partita. Esempio: squadra A contro squadra B; la squadra A segna per prima e va sull'1-0; la squadra B pareggia e va sull'1-1; la squadra A quindi segna il 2-1, e la squadra B segna il definitivo 2-2. In questa partita, la squadra A ha segnato 2 "leading goal", concedendo 2 reti del pareggio; al contrario, la squadra B ha segnato 2 reti del pareggio e ha concesso 2 "leading goal" all'avversario.


giovedì 18 dicembre 2014

Scoring trends


In the following table there are the goals scored per game in the main 10 European leagues, considering the last 5 seasons plus the current one until the last weekend's matches (included).
You can also see the trend for each league.

Dutch Eredivisie is the league where most goals per game are scored every season.
This season, England and Spain have a decrease compared to all the previous 5 years.
Belgium and Portugal are the only ones that have an increment in respect to the last season.


[​IMG]


Nella tabella soprastante potete vedere il numero di reti per partita segnate nei dieci principali campionati europei, considerando le ultime 5 stagioni e quella attuale, fino allo scorso weekend incluso.
All'estrema destra di ciascuna riga si può vedere il trend del rispettivo campionato.

La Eredivisie olandese è la lega dove viene segnato il maggior numero di reti ogni stagione.
Quest'anno, Inghilterra e Spagna hanno una diminuzione di reti in confronto alle ultime 5 stagioni.
Belgio e Portogallo sono gli unici paesi che hanno un aumento rispetto all'anno scorso.


martedì 16 dicembre 2014

Which are the most prolific teams at the beginning and at the end of the match?


Considering the 10 main European leagues, these are the clubs who scored the most in the injury time (after 90th minute):
Arsenal (ENG, 5 goals)
Porto (POR, 4)
Espanyol (ESP, 4)
Lazio (ITA, 3)
Roma (ITA, 3)
Lyon (FRA, 3)
Marseille (FRA, 3)
Monaco (FRA, 3)
Sporting CP (POR, 3)

These are the ones who scored the most in the first 15 minutes of the match:
Valencia (ESP, 9 goals)
Wolfsburg (GER, 8)
Chelsea (ENG, 7)
Benfica (POR, 7)
Moenchengladbach (GER, 7)
Stoke City (ENG, 6)
Sporting CP (POR, 6)
Real Madrid (ESP, 6)

As you can see, Sporting CP are present in both the rankings; they have a curious distribution of goals:
1-15: 6 goals
16-30: 1
31-45: 2
46-60: 3
61-75: 6
76-90: 4
>90: 3
They score very few goals between 16th and 60th minute, but they balance scoring more in the rest of the match, injury time included.


Considerando i dieci principali campionati europei, questi sono i club che hanno segnato di più nel tempo di recupero (dopo il 90° minuto):
Arsenal (ENG, 5 reti)
Porto (POR, 4)
Espanyol (ESP, 4)
Lazio (ITA, 3)
Roma (ITA, 3)
Lyon (FRA, 3)
Marsiglia (FRA, 3)
Monaco (FRA, 3)
Sporting CP (POR, 3)

questi sono quelli che hanno segnato di più nei primi 15 minuti della partita:
Valencia (ESP, 9 goals)
Wolfsburg (GER, 8)
Chelsea (ENG, 7)
Benfica (POR, 7)
Moenchengladbach (GER, 7)
Stoke City (ENG, 6)
Sporting CP (POR, 6)
Real Madrid (ESP, 6)

Si può notare che lo Sporting CP è presente in entrambe le classifiche; questa squadra ha una distribuzione delle reti piuttosto curiosa:
1-15: 6 reti
16-30: 1
31-45: 2
46-60: 3
61-75: 6
76-90: 4
>90: 3
I portoghesi hanno segnato pochi gol tra il 16° e il 60° minuto, ma controbilanciano segnando di più nel resto della partita, recupero incluso.


lunedì 15 dicembre 2014

Precedents in the Champions League round of 16


In the round of 16 there will be 3 unprecedented matches: Shakhtar Donetsk-Bayern MunichArsenal-Monaco and Basel-Porto.

Three matches were played only once in the past. Two of them were played last year in the same round: Manchester City - Barcelona (Barcelona won 2-0 in Manchester and 2-1 at home) and Schalke 04 - Real Madrid (Real dominated 6-1 and 3-1).

Also Bayer Leverkusen - Atlético Madrid was played just once, in 2010-2011 Group Stage: both matches ended 1-1.

Paris SG and Chelsea played against each other twice, in 2004-2005 and 2013-2014. The total balance sees 2 wins for Chelsea, 1 for PSG and a draw. Last year they played the quarter-final: Chelsea lost 1-3 in Paris and then won 2-0 at home, managing to go through.

Juventus and Borussia Dortmund confronted each other 4 times, with a total of 7 matches played: the balance is in favour of Juventus, with 4 wins, 1 draw and 2 losses. However, Borussia won 3-1 the most important one: the CL final in 1996-1997; this is also the last match played between these two clubs.


Negli ottavi di finale ci saranno tre partite che non hanno precedenti in Europa: Shakhtar Donetsk-Bayern Monaco, Arsenal-Monaco Basilea-Porto.

Tre partite sono state giocate una sola volta in passato. Due di queste sono state giocate la scorsa stagione sempre negli ottavi di finale: Manchester City - Barcellona (il Barcellona vinse 2-0 a Manchester e 2-1 in casa) e Schalke 04 - Real Madrid (il Real dominò 6-1 e 3-1).

Anche Bayer Leverkusen - Atletico Madrid è stata giocata una sola volta, nella fase a gironi della stagione 2010-2011: entrambe le partite finirono 1-1.

Paris SG e Chelsea si sono affrontate due volte, nel 2004-2005 e nel 2013-2014. Il bilancio vede 2 vittorie del Chelsea, 1 del PSG e un pareggio. L'anno scorso si sono affrontate nei quarti di finale: il Chelsea perse 1-3 a Parigi e poi vinse 2-0 in casa, riuscendo così a passare il turno.

Juventus e Borussia Dortmund si sono affrontate 4 volte, per un totale di 7 partite: il bilancio è favorevole alla Juventus, con 4 vittorie, 1 pareggio e 2 sconfitte. Comunque, il Borussia ha vinto 3-1 la partita più importante, e cioè la finale di Champions League del 1996-1997; questo è anche il precedente più recente tra le due squadre.


venerdì 12 dicembre 2014

European Cups: Legia Warsaw is the best team after the Group Stage


According to the ECRS, after the Group Stage Legia Warsaw* (Poland) kept the lead of the ranking, with 325,83 points.
At the second place, Dynamo Moscow (Russia) gained a couple of points and now they have 322,06.
At the third place, with 289,95 points, we find Villareal (Spain).

The best team in Champions League is Porto (Portugal), at 5th overall place with 278,58 points.

The worst team still in the competition is Liverpool (England), who are in the 122nd position, with 83,99 points.

The complete ranking is here.

* Please note: Legia Warsaw was punished by UEFA for fielding an ineligible player in their 2-0 second leg's win over Celtic in the third qualifying round. I decided to consider it as a 0-3 lost, as stated by the official UEFA sentence.


Secondo l'ECRS,  dopo la fase a gironi il Legia Varsavia* (Polonia) è rimasto in testa alla classifica con 325,83 punti.
Al secondo posto c'è la Dinamo Mosca (Russia), che ha guadagnato un paio di punti sul Legia e ora ne ha 322,06.
Al terzo posto c'è il Villareal (Spagna) con 289,95 punti.

La squadra migliore in Champions League è il Porto (Portogallo), al quinto posto generale con 278,58 punti.

La squadra peggiore ancora in gara è il Liverpool (Inghilterra), che occupa la 122esima posizione con 83,99 punti.

La classifica completa si trova qui.

* Il Legia Varsavia è stato punito dalla UEFA per aver schierato un giocatore in modo irregolare durante la partita vinta per 2-0 contro il Celtic nel ritorno del terzo turno di Champions League. Ho quindi deciso di considerare quella partita come una sconfitta per 0-3, come stabilito dalla sentenza UEFA.

sabato 6 dicembre 2014

Most efficient teams in keeping an advantage and in coming back


I checked which are the most efficient teams in winning games after they scored the first goal.

In the tables below there are the top 10 (considering the main 6 European leagues) for the last and the current season.
The FTS/total field indicates how many times the team scored first on the total of the matches played (only in the domestic league).
The percentage is simply the ratio between these two numbers.
The W D L fields shows how the matches ended for that team, and the avg pts are the average points made by the team on those matches.
For the ranking to be more consistent, I considered only the teams that scored the first goal in at least half of the games played.


You can see that in this season there are 4 teams that always won the matches which they scored first in.
[​IMG]


I did the same thing for the teams whose opponent scored first, to see which are the best teams in coming back after having conceded the first goal of the match.
The fields are as above, with the difference that here are considered the matches which the opponent scored first in.

[​IMG]


Ho verificato quali sono le squadre più efficienti nel vincere le partite dopo aver segnato il primo gol dell'incontro.
Nelle prime due tabelle in alto ("First to score") sono elencate le prime 10 squadre (considerando i 6 principali campionati europei) dell'ultima stagione e di quella attuale.
Il campo FTS/total indica quante volte la squadra ha segnato per prima sul totale delle partite giocate (solo in campionato).
La percentuale è il rapporto tra questi due numeri.
I campi W D L mostrano come le partite sono terminate per quella squadra, mentre avg pts è la media dei punti ottenuti in quelle partite.
Ho considerato solamente le squadre che hanno segnato per prime in almeno la metà delle partite giocate.
Si può notare che quest'anno ci sono 4 squadre che hanno sempre vinto dopo aver segnato il primo gol dell'incontro.

Le seconde due tabelle ("Opponent scores first"), al contrario, si riferiscono alle squadre che hanno concesso il primo gol dell'incontro, mostrando quali sono le migliori squadre in rimonta.
I campi sono gli stessi mostrati sopra, con la differenze che per ogni squadra sono considerate solo le partite in cui ha subìto gol per prima.


venerdì 5 dicembre 2014

Domestic ranking as of 5 December 2014


This is the European club teams ranking according to the Domestic Leagues Ranking System.
As explained in the linked post, this system takes into account the matches played in the 10 main European leagues, with the points made, the goals scored and conceded by each team, and the strength of the league.

These are the best ten teams as of today, 5 December 2014:


You find the complete ranking and the legend here.


Nella tabella qui sopra si vedono le prime 10 posizioni della classifica secondo il Domestic Leagues Ranking System. Come spiegato nel post, questo sistema prende in considerazione le partite giocate nei dieci principali campionati europei, con i punti fatti, i gol segnati e quelli subiti da ciascuna squadra, e la forza del campionato.

Nella tabella vedete le migliori dieci squadre ad oggi, 5 dicembre 2014.

Qui trovate la classifica completa e la legenda.